Bullish Pattern - Horizontal Support
A bullish continuation pattern that signals the continuation of an uptrend after a brief consolidation period.
Watch video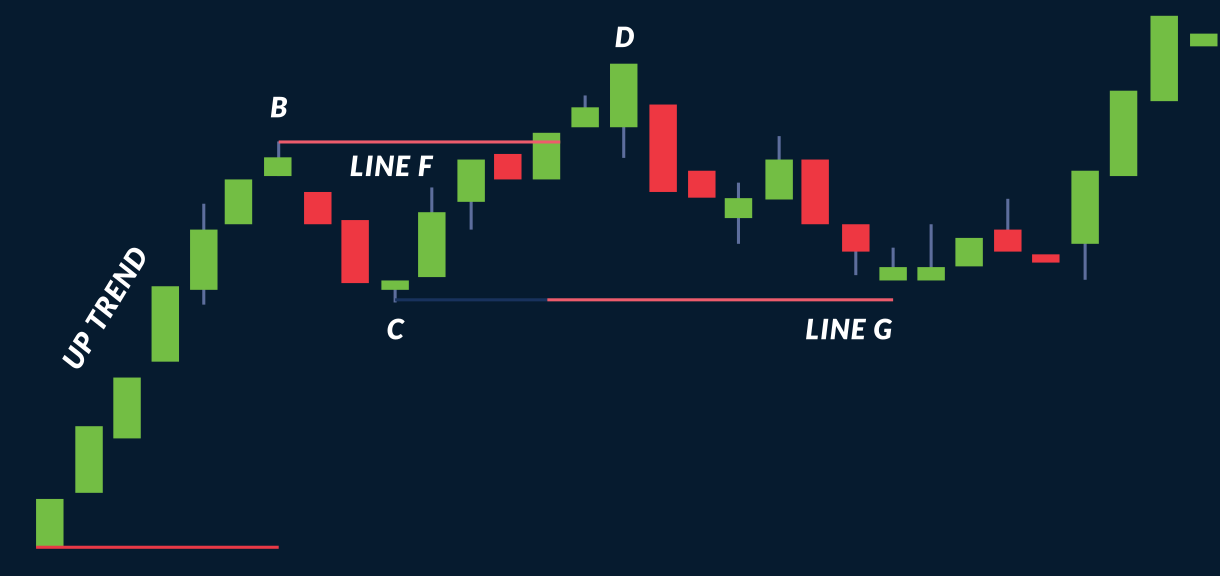
Pattern Overview
It is a YC bullish, trend continuation pattern, widely present in technical analysis literature.
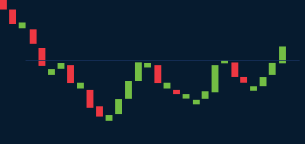
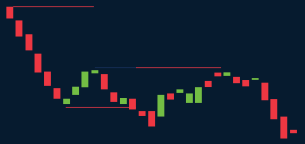
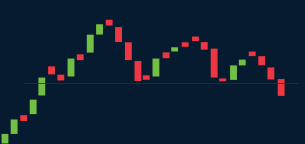
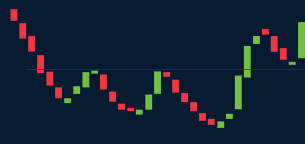
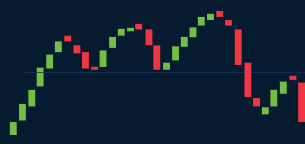
Uptrend Identification: The market exhibits an uptrend, reaches a peak, then retraces to form a low. (Point C)
Support Formation: After setting a new high (Point D), the market retraces to a horizontal level that previously acted as a launch point. (Line G)
Formation
Wait for at least two valid bounces and a clean structure before planning entry.
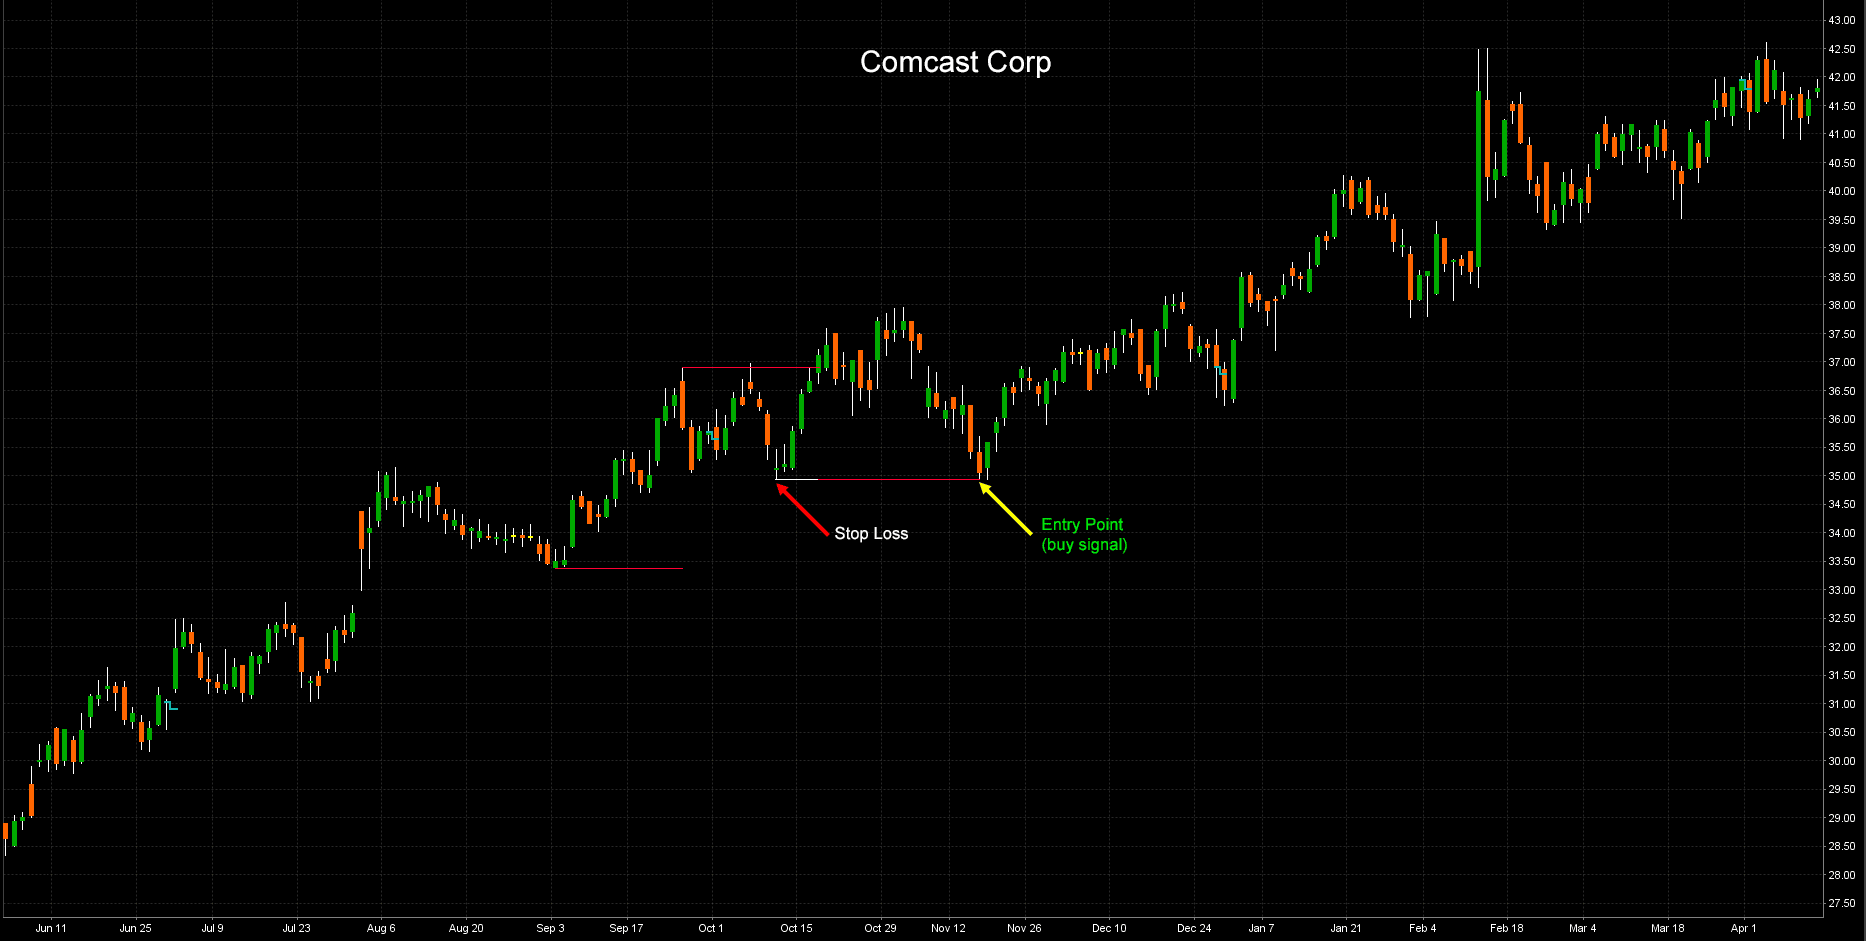
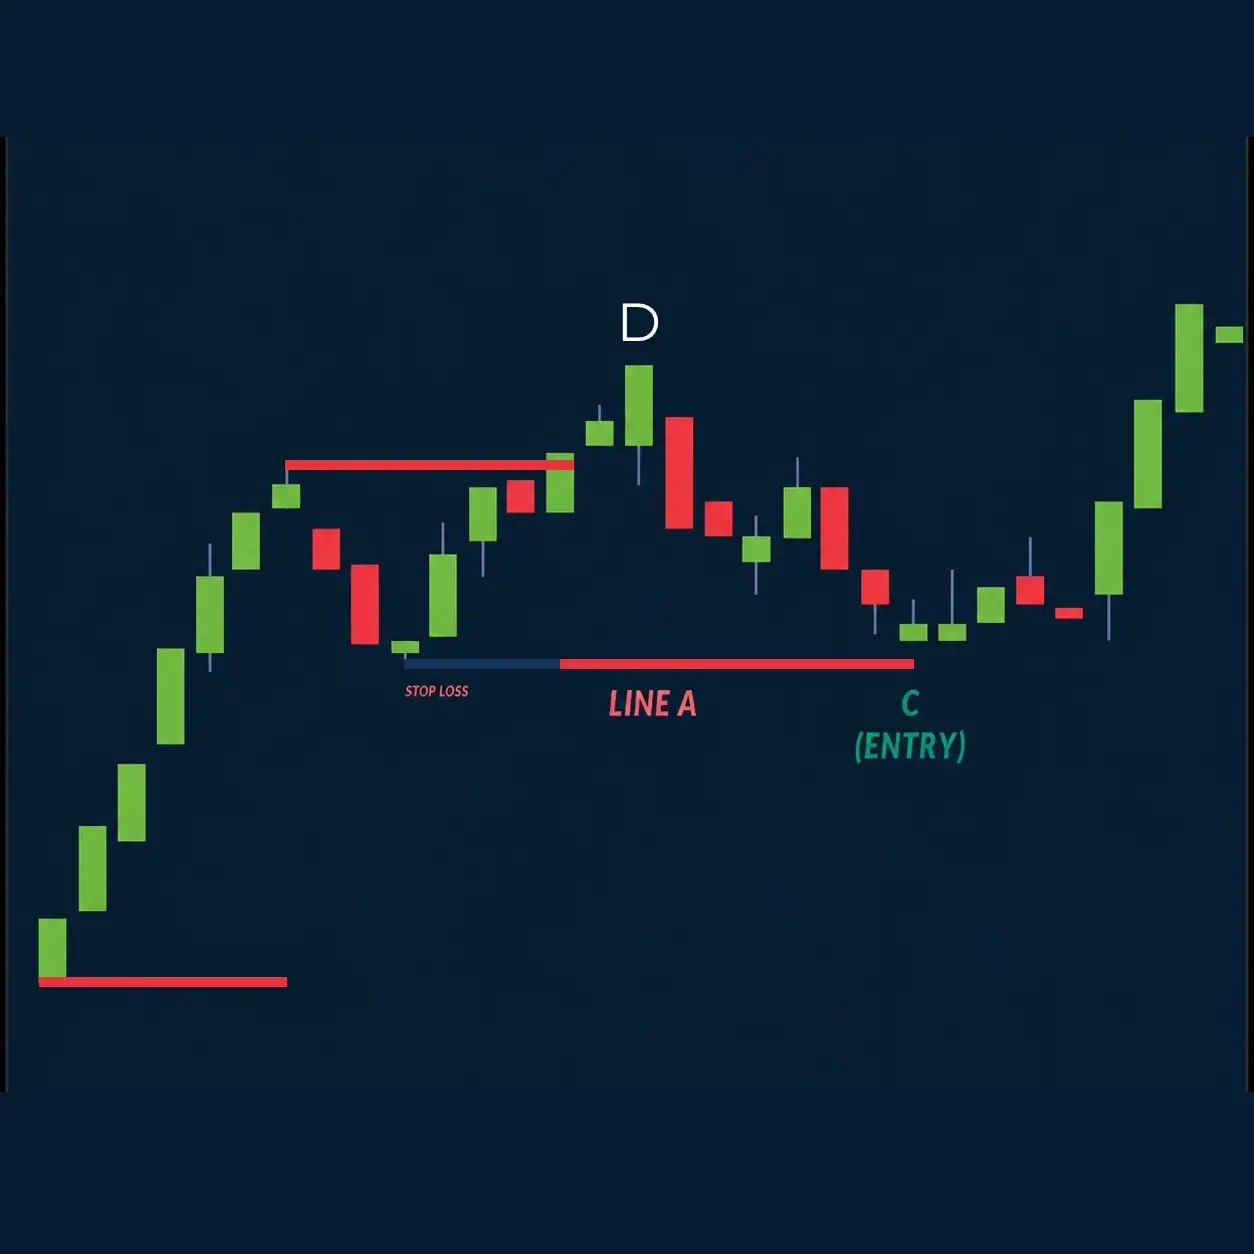
Entry Point: Initiate a bullish trade when price nears established horizontal support. At point C above line A.
Risk Management: Position a stop loss below the support line. Below line A.
Signal Confirmation
A bullish setup is confirmed after breakout and controlled retest near the key level. Place stop loss below invalidation.
10% Alert: Triggered when the price retraces 90% of the distance from recent high (point D) to previous support on line A.
5% Alert: Triggered when the price retraces 95% of the same distance (point D to line A).
Historical Performance
Historical cases show meaningful upside when confirmation and risk management are respected.
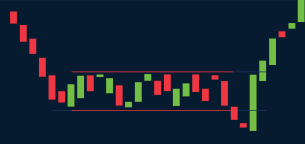
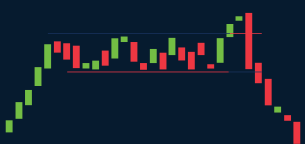
Some Examples