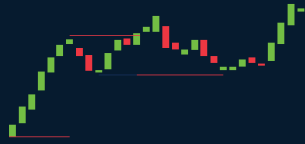
Bearish Pattern - Top End Sweep
A bearish reversal pattern that signals the start of a downtrend following an extended consolidation period.
Pattern Overview
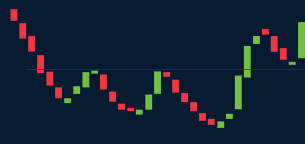
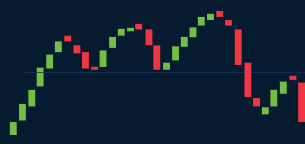
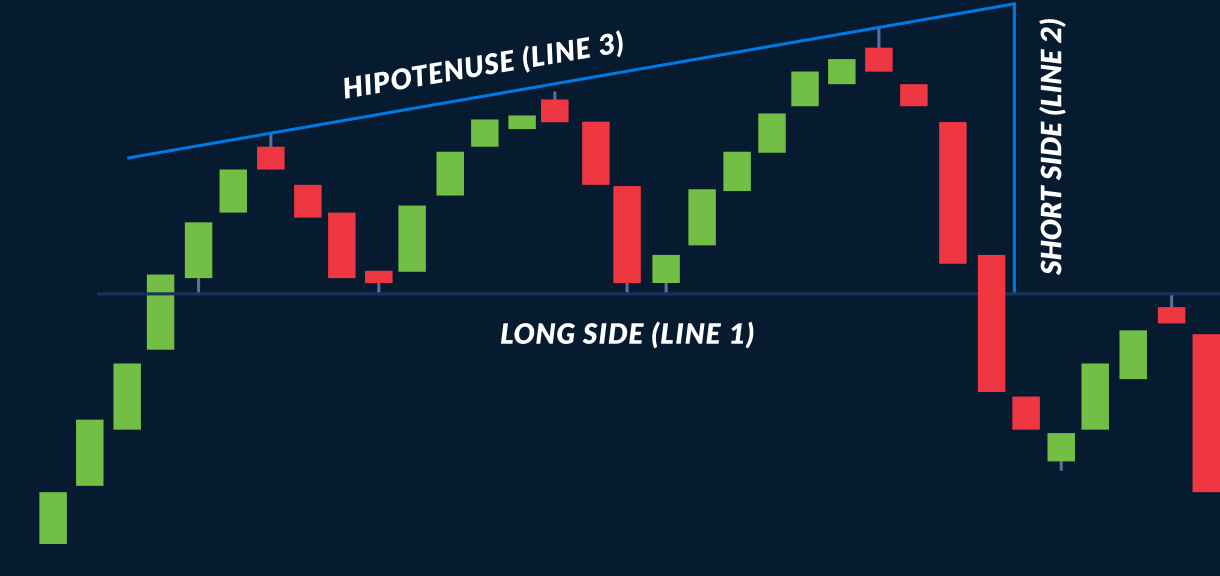
It is a YC bearish trend reversal pattern comparable to an imaginary right triangle. It is made up of two sides that meet at a 90 degree angle, linked by a hypotenuse.
Horizontal Line (Long side): Connects two or more roughly equivalent market lows. (Line 1)
Vertical Line (Short side): Extends from the horizontal to the highest point above it. (Line 2)
Hypotenuse: Connects ascending market highs, reflecting bounces above the horizontal. (Line 3)
Formation
Wait for at least two valid bounces and a clean structure before planning entry.
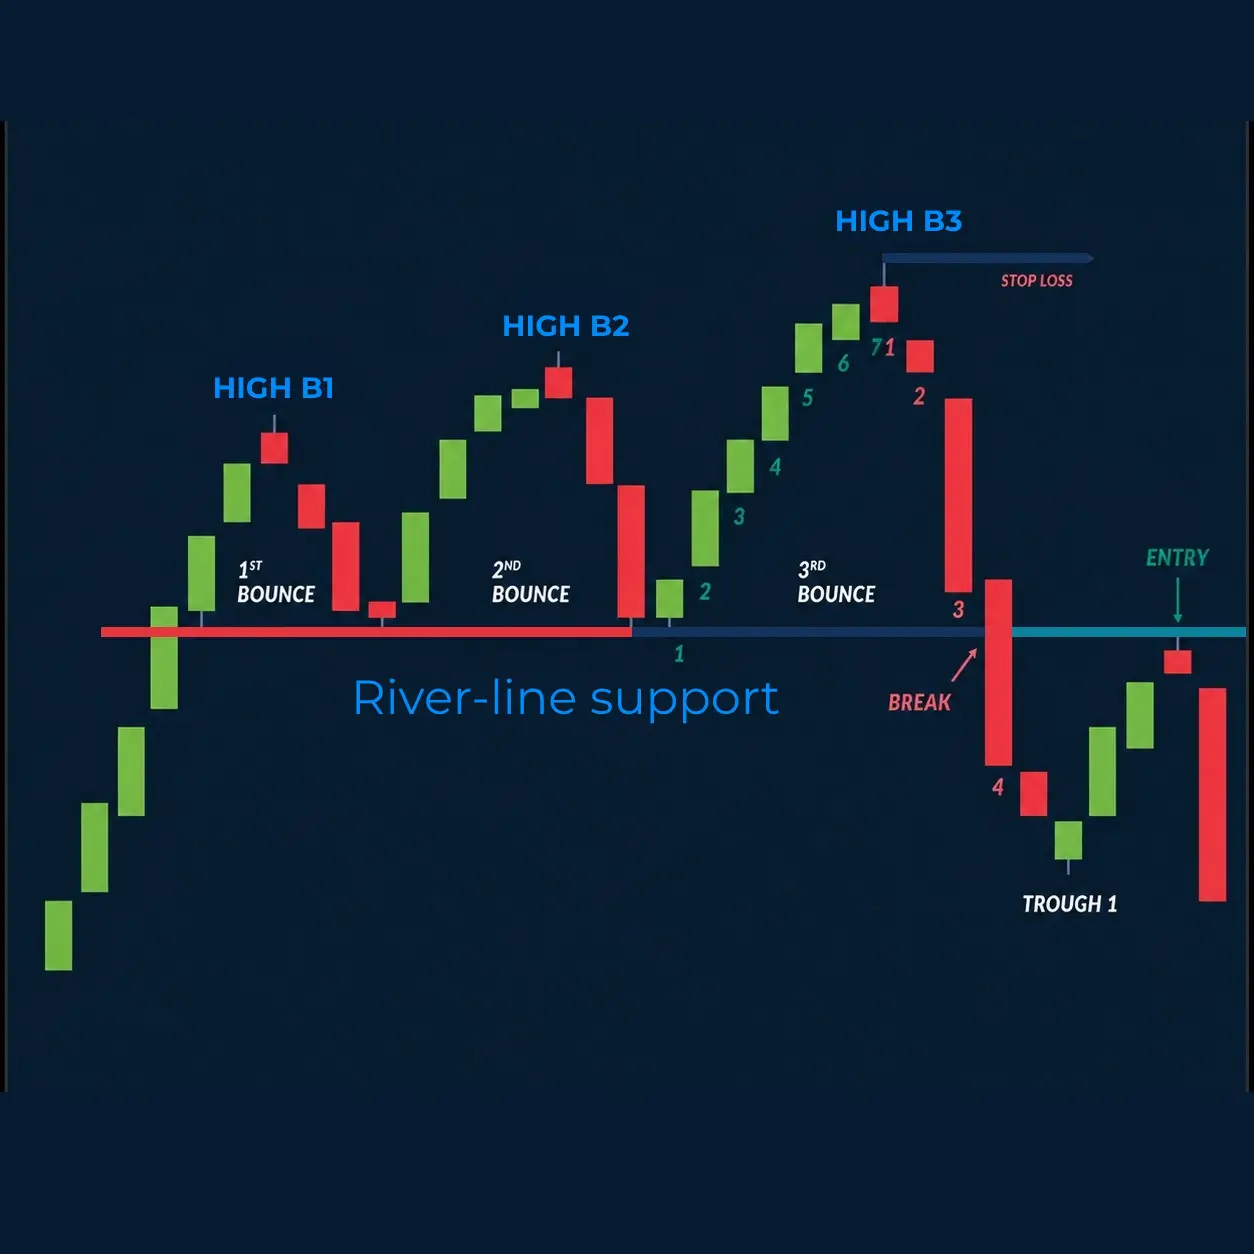
Requires at least two, ideally three, bounces with ascending highs above the horizontal river-line support.
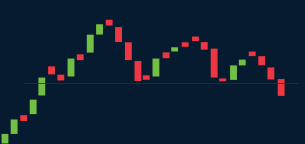
Velocity within bounces: Rises from the horizontal river-line to highs (B1, B2, B3) should be slower than the declines back to it (see candle counts in the pic).
Signal Confirmation
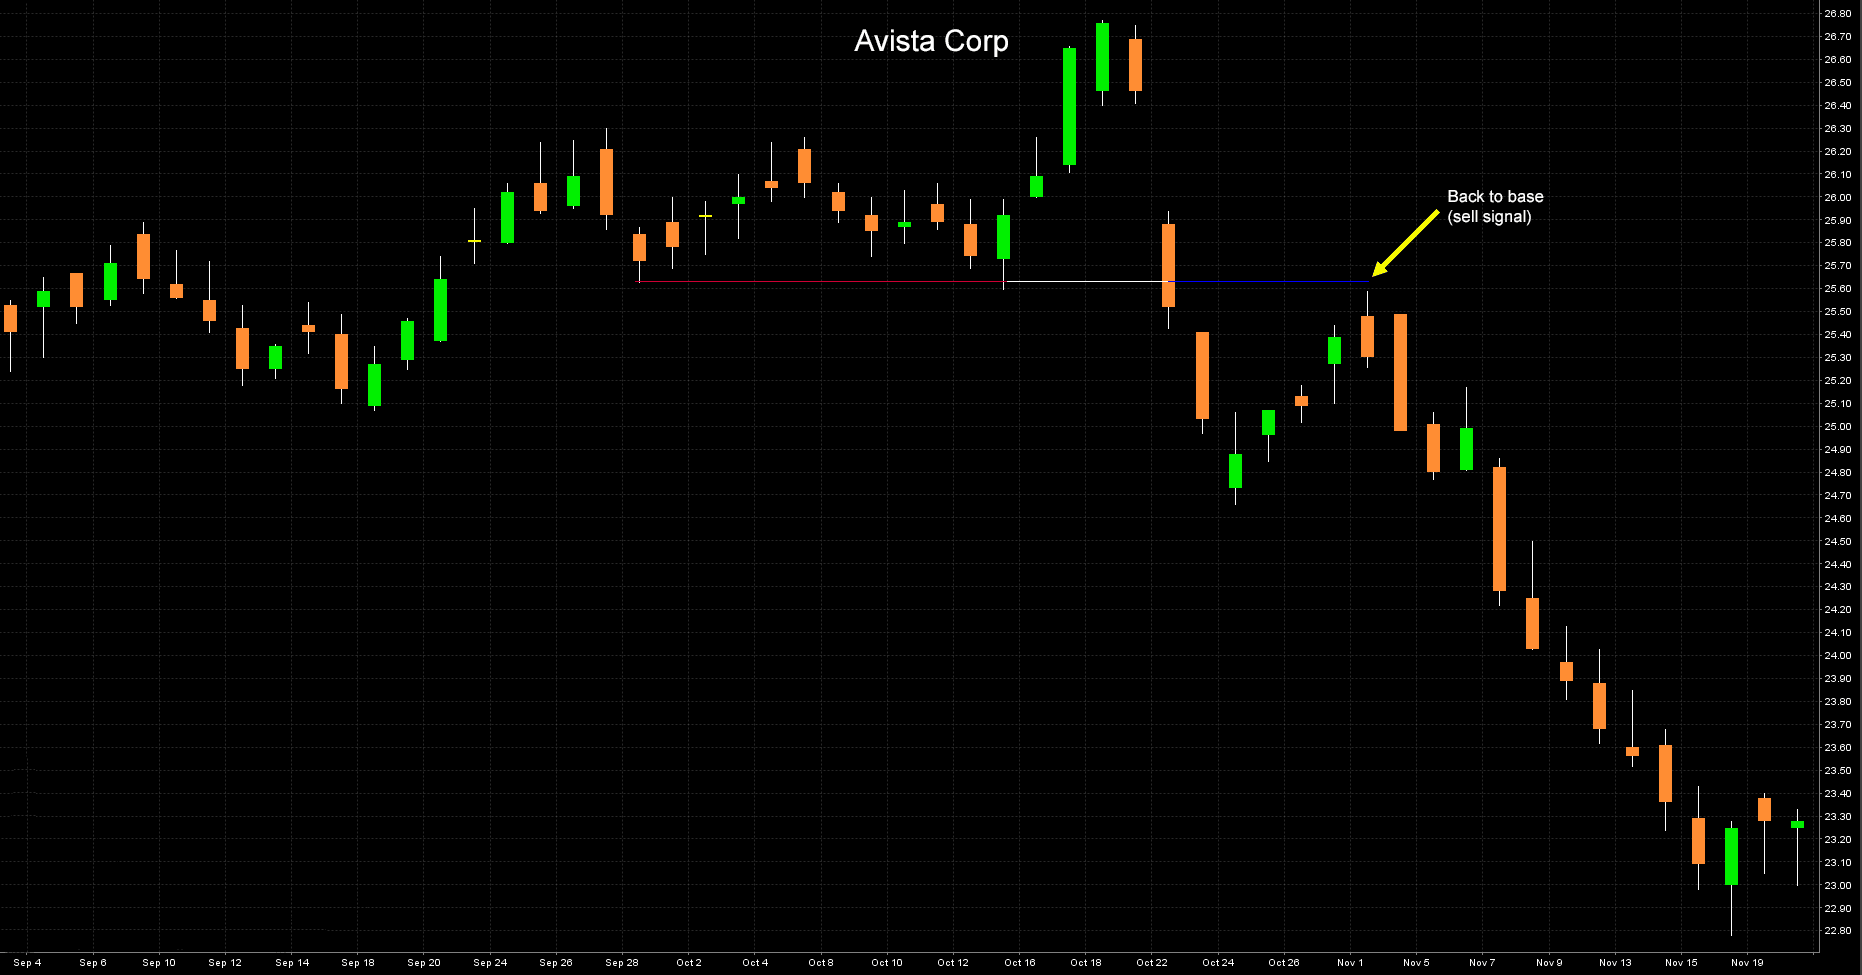
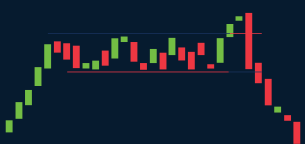
A bearish setup is confirmed after breakdown and controlled retest near the key level. Place stop loss above invalidation.
The pattern is confirmed after a breakdown below the horizontal and a subsequent retracement close to that level.
A stop loss should be set just above the last bounce high or within a trader-defined percentage, depending how high from each other highs B2 and B3 are.
Historical Performance
Historical cases show meaningful downside when confirmation and risk management are respected.
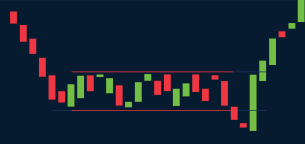
Some Examples